
Dr Richard Peters, Peters Research Ltd.
Mr Rory Smith, ThyssenKrupp Elevator, Inc.
Key Words: Destination control, destination dispatch, traffic analysis, survey, simulation
This paper was presented at ELEVCON THESSALONIKI 2008, The International Congress on Vertical Transportation Technologies and first published in the IAEE book “Elevator Technology 17”, edited by A. Lustig. It is reproduced with permission from The International Assocication of Elevator Engineers. This web version © Peters Research Ltd 2009.
Abstract
With destination control, passengers are asked to enter their destinations individually on the landings. The system responds by telling each passenger which elevator to use. Logging of destination control system data allows the operation of the elevators and passengers movements be re-played and analysed as if running a simulation. This assists in verifying and enhancing system performance. Calls logged by destination control correlate better with actual passenger demand than calls logged by conventional control. Data from a modernised elevator installation is used to assess elevator performance before and after a modernisation.
1. Introduction
Most conventional elevator systems have up and down hall call buttons at each floor, except at the top and bottom floors where only one button is required. With destination control, each passenger is invited to enter their destination floor at the landing and the system responds by indicating which elevator to use. ThyssenKrupp TAC50 Destination DispatchTM [1][2] can operate with destination input, conventional up and down hall call buttons, or a combination of all of these.
In this paper we review the logging of elevator performance and passenger demand in a high rise building in North America operating TAC50 Destination Dispatch. In this installation, the elevators are operating as a full destination control system. Destination input is provided on every floor with touch screens.
Logging destination control operation, it is easier to monitor passenger demand than with conventional traffic analysers, as every passenger is asked to register a call [3]. Destination control also provides an opportunity to measure the quality of service from the passengers’ prospective, as it is known when every call is registered, answered, and completed.
2. Logging
2.1 Data collection and playback
ThyssenKrupp TAC50 Destination Dispatch elevators include logging software that can record every movement of the elevators and every passenger destination call. This is similar to the approach presented by Beebe [4], but a proprietary ThyssenKrupp data exchange format has been used to reduce file size. The logging data can be replayed in Elevate[TM] as if the user is running a simulation as shown in Figure 1. The playback can be paused at any time to examine in detail current elevators status and calls.
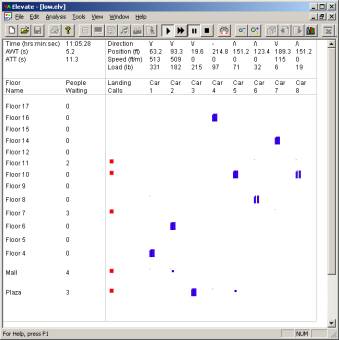
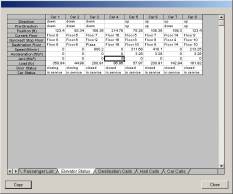
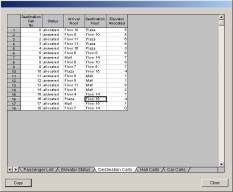
Figure 1 Elevate replaying logging data
At the same time as the logging data is being replayed, an analysis of passenger demand and elevator performance is completed. The calculated passenger traffic demand is based on the presumption that one destination call corresponds to one person. In future versions logged load weighing data may be used to improve on this assumption.
Once playback is completed, the calculated passenger demand can be used to run a simulation. This tests how the system should be performing based on current demand. In the examples following in Section 3, simulation has also been used to model operation of the old system prior to modernisation.
2.2 Measures of performance
Traditional traffic analysers measure hall call response time. This is all they can measure, as they are not aware of passengers. The system only “sees” hall calls (and car calls). With destination control each passenger is invited to register his or her own call, so individual passenger waiting times can be measured. The waiting time is the time from when the call is registered until the doors, on the elevator the passenger is assigned to, begin to open. Time to destination (waiting time plus the transit time) can also be measured. Waiting time and time to destination are better measures of the quality of service a passenger receives than hall call response time as they truly reflect a passenger’s “experience”. These parameters are represented diagrammatically in Figure 2, where two passengers (P1 and P2) traveling between the same floors arrive at different times, but use the same elevator.
Figure 2 Waiting time and time to destination
3. Results based on simulation and logging
3.1 All day results
Figures 3, 4 and 5 show average waiting time and time to destination for a typical day in the example building. The results show a high level of consistency between the logged and simulated results for the new installed system. There is a significant improvement relative to the old system.
Figure 3 All day results for low rise elevators
Figure 4 All day results for mid rise elevators
Figure 5 All day results for high rise elevators
3.2 Results by time of day
As opposed to whole day averages, Figures 6 to 11 show the passenger demand measured by the logging on a continuous basis throughout a typical day. Each demand curve is followed by a plot of the measured time to destination (as logged by the system) and results for the simulation of the installed system, and the old system. Again, there is good consistency between the logged and simulated results for the new installed system and a significant improvement relative to the old system.
For passenger demand plots, traffic travelling up the building is show in the top portion of the graphs, and traffic travelling down the building is show in the bottom portion. There is a noticeable peak in the morning around 9 am. People travel down to take lunch out of the building with a peak around 12 noon. The return from lunch peaks at around 1 pm. There is also a noticeable down peak as people travel home at the end of the day.
Figure 6 Low rise demand
Figure 7 Low rise time to destination
Figure 8 Mid rise demand
Figure 9 Mid rise time to destination
Figure 10 High rise demand
Figure 11 High rise time to destination
3.3 Day to day variations in demand
Plotting data for a whole week demonstrates a high level of consistency in passenger demand. Each rise has a recognisable passenger demand pattern or “signature”.
Figure 12 Low rise passenger demand for one week
Figure 13 Mid rise passenger demand for one week
Figure 14 High rise passenger demand for one week
4. Further benefits of the upgraded system
The new installation can move more people more quickly, partly because of faster equipment, partly because of more intelligent control. This makes it less likely to overload or “saturate” during busy periods.
To demonstrate this, we have used the simulation to test how the old and new systems perform when presented with a constantly increasing stream of traffic. This is a recognized way to test the performance of elevator systems to their limits. The example in Figures 15 and 16 is based on the low rise up peak. During this time, 63% of the traffic was incoming, 22% outgoing, and 15% interfloor.
Figure 15 Waiting time for increasing traffic demand
Figure 16 Time to destination for increasing traffic demand
The old system begins to overload at around 100 persons per five minutes, while the new system continues to work well. Waiting time and time to destination increase, but the system does not “saturate”. Destination control elevators are less likely to saturate as a result of up peak traffic [5]. The ability to cope with greater passenger demand means that the installation can manage better if there is ever a car out of service.
5. Discussion
Logging to the level of detail presented in this paper provides an enormous amount of data. Most of the graphs used in simulation design (passenger demand, passenger activity, queue lengths, distribution of waiting times, etc.) can be generated daily. This provides the basis for validating the original design, the current performance of the elevators, and even specific design features.
It has been found that an unusually long passenger waiting time almost always indicates that something is amiss. Replaying the operation of the elevators during the long wait incident assists in diagnosing the problem. Applying this approach, hardware, software and general maintenance issues can be identified and addressed. Without logging, these issues could go unnoticed.
Operation of specific features can also be observed. For example, occasional passenger misuse of the elevators is observed in logging. In one instance 29 calls were registered at a landing to the same destination, but the load weighing recorded that only one person loaded the car. The logging confirmed that the dispatcher successfully marked the majority of these calls as false, revising its dispatching optimisation process accordingly.
Logging also increases our understanding of passenger demand, which assists both in the elevator selection process and in the design of elevator dispatchers.
6. Conclusions
For the example building considered in this paper, there is a high degree of consistency between the performance measured by logging and the simulation of the installed system. Simulation of the old system based on existing passenger demand has also quantified the improvements achieved through modernisation. The improvement have been confirmed by the client, and further backed up by anecdotal evidence from people working in the building.
Daily logging reports delivered automatically by email provide a detailed analysis of current performance and highlight any problems to building management immediately. Problems can be investigate in detail by replaying the scenario leading up to incident, for example an unusually long passenger waiting time. This approach has highlighted software, hardware and maintenance issues, which otherwise may not have been identified. The detail in which the system performance can now be examined is unprecedented.
The full logging reports also detail the distribution of waiting times and queue lengths, in the same format as presented in an Elevate simulation. The consistency of presentation between simulation and logging makes it easier for those familiar with simulation to interpret results.
REFERENCES
- Smith R, Peters R ETD Algorithm with Destination Dispatch and Booster Options Elevator Technology 12, Proceedings of ELEVCON 2002 (The International Association of Elevator Engineers) (2002)
- Smith R, Peters R Enhancements to the ETD dispatching Elevator Technology 14, Proceedings of ELEVCON 2004 (The International Association of Elevator Engineers) (2004)
- Peters R, Evans E Measuring and Simulating Elevator Passengers in Existing Buildings Elevator Technology 17, Proceedings of ELEVCON 2008 (The International Association of Elevator Engineers) (2008)
- Beebe J, An XML-based standard for communicating elevator information Elevator Technology 15, Proceedings of ELEVCON 2005 (The International Association of Elevator Engineers) (2005)
- Peters R, Understanding the benefits and limitation of destination dispatch Elevator Technology 16, Proceedings of ELEVCON 2006 (The International Association of Elevator Engineers) (2006)