
Rory S. Smith
P. O. Box 36774, Dubai – United Arab Emirates
This paper was presented at The 1st Symposium on Lift & Escalator Technology (CIBSE Lifts Group, The University of Northampton and LEIA) (2011). This web version © Peters Research Ltd 2019
1. Introduction
The quantity of passengers to be transported by a lift system is a primary consideration in lift system design.
Research indicates that passenger demand in modern office buildings is significantly different to the assumptions formed many decades ago, but still applied to most modern designs.
The number and type of lifts required to provide a proper and efficient lift service may need to be revised based on these findings. These changes in lift system design have economic and environmental consequences that are favorable.
2. Historical representations of passenger demand
A plot of passenger demand depicts the level of passenger traffic in a group of lifts over a period of time. Figure 1 shows estimated passenger demand for an office building over the working day with a population of 1000 people. This has been generated by applying the example of office passenger demand presented by Strakosch [1] over 40 years ago. In this representation of passenger demand, passengers travelling up are shown in the top section of the graph, with passengers travelling down in the lower section.
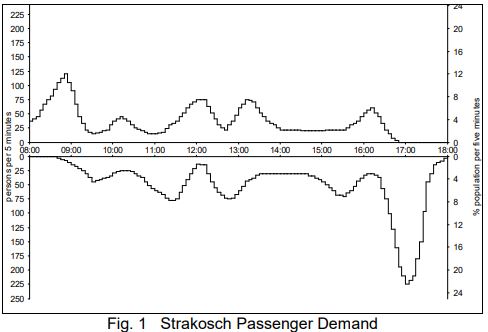
It was generally believed that the most demanding traffic type was the morning up peak. This belief was reinforced by research conducted by Barney that showed that lifts have between 20% and 60% more capacity during non up-peak conditions [2].
It has been assumed by many in the lift industry that most office buildings had a pattern of passenger demand similar to those in Figure 1.
3. Modern buildings
How people use lifts and the traffic patterns that their use generates has changed since 1923, when Basset Jones published formulae for the expected number of stops a car will make during a round trip [3]. Summarising the results of a series of peak time traffic surveys carried out between 1993 and 1997 Peters concluded, “Morning traffic peaks are less marked in buildings than they were when traditional up peak design criteria were formulated. In work-related buildings occupied during the day, the busiest period appears to be over the lunch period” [4]
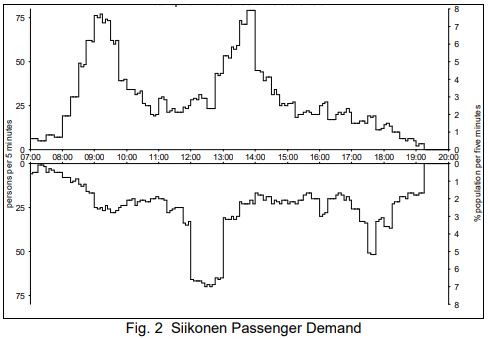
In 2000 Siikonen presented a traffic pattern that represents traffic measured in a modern installation [5].
This pattern is quite different from the traffic pattern presented by Strakosch. Siikonen shows a lunch up peak that is the same size as the morning up peak. Additionally, the down peak at lunch is more intense than the evening down peak. These observations raise a question, are the differences in the patterns due to the unique nature of the building studied by Siikonen or have traffic patterns changed over the years?
In order to better understand modern lift traffic, data was collected at a number of office buildings in different parts of the world including Europe, North America and the United Arab Emirates.
In most cases data was collected by manual count. However, in one building, data from three groups of lifts in a corporate headquarters building was gathered electronically.
Figure 3 shows the results of lift traffic surveys for seven separate groups of lifts [6]. The surveys were undertaken applying a methodology defined by Peters and Evans [7]. The passenger demand is normalised against observed population to allow results to be compared between buildings
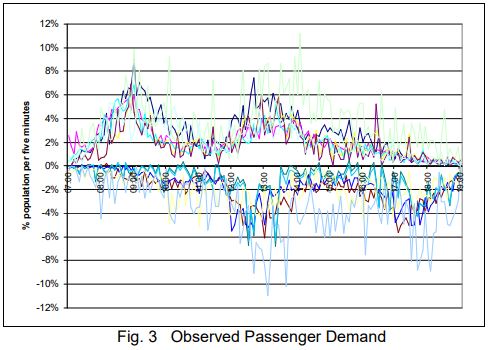
On average, the mix of traffic in modern buildings during the morning up peak was found to be approximately 85% incoming, 10% outgoing and 5% inter-floor.
On average, the mix of traffic in modern buildings during the busiest part of lunch was found to be 45% incoming, 45% outgoing and 10% inter-floor.
None of the groups surveyed have the sharp down peak that is seen in the Strakosch pattern. In modern office buildings with professional workers, a significant portion of office workers are working later than in previous years.
4. Simulation
Simulation can be used to evaluate lift system performance based on modern traffic levels and traffic patterns. Simulation can also apply modern dispatching algorithms such as those based on destination selection. The performance of advanced drive and door systems can also be modelled.
Figure 4 shows the relative performance of two lift systems in a hypothetical building as determined by simulation and using modern traffic mixes.
The Up Peak Round Trip Time (UPRTT) method indicated this building should be fitted with 6 1350kg lifts operating at 2.5m/s.
The traditional system used a generic group control system and had the performance criteria used in the UPRTT method. The Optimized system used a proprietary destination based system and high performance door and drive systems
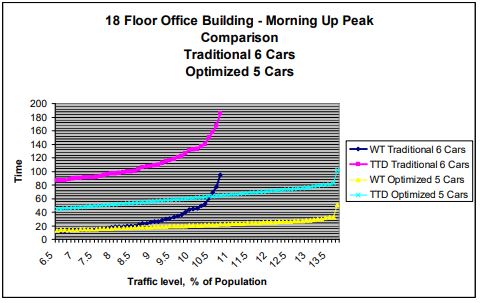
Figure 4
The Optimized system with 5 cars outperforms the Traditional system with 6 cars.
5. Conclusions
This research has indicated that in many cases it may be possible to install fewer lifts than would be indicated using the UPRTT method and still achieve excellent traffic handling.
Simulation was found to be a better method of predicting lift system traffic handling performance than the UPRTT method.
REFERENCES
- Strakosch G, editor. The Vertical Transportation Handbook. John Wiley. New York (1998)
- Barney, G. Elevator Traffic Handbook. Spon Press; London (2003)
- Barney, G. Elevator Traffic Handbook. Spon Press; London (2003)
- Peters R D. Vertical Transportation Planning in Buildings British Library reference DX199632 (1998)
- Siikonen M, Elevator Technology 10, IAEE, Israel (2000)
- Peters Research Ltd private client reports.
- Peters R, Evans E Measuring and Simulating Elevator Passengers in Existing Buildings Elevator Technology 17, Proceedings of ELEVCON 2008 (The International Association of Elevator Engineers) (2008)